Wednesday, 4 September 2024

Jamovi Regression Analysis Guide for Students Seeking Assignment Help

Jamovi is an open-source and easy to use statistical software for conducting data analysis, appealing to both novices and experts. Designed by the developers of JASP, it has an intuitive interface and enhanced analytical capabilities without the need of any programming codes as used in SAS, R, SPSS etc. It is increasingly becoming popular with over 30% increase in annual downloads, which has been attributed to its ability to integrate with R allowing customization. Jamovi has always been updated with latest capabilities to handle complex analysis and bug fixes. 

Though certain benefits are enjoyed, a number of learners face challenges when using Jamovi software for data analysis especially in regard to conducting regression analyses. Attempting to interpret the output, choosing the correct model, and correctly interpreting the results are examples of common problems encountered. Due to these reasons most of them want to utilize Jamovi assignment help in overcoming the difficulties and also ensuring that their assignment solutions meet the required academic standards.

jamovi regression assignment help


Understanding Regression Analysis in Jamovi 

Regression analysis is a statistical method used to understand the relationship between a dependent variable and one or more independent variables. In simpler terms it assists in predicting the effects on the dependent variable due to the changes in the independent variables. This is especially useful in disciplines including economics, psychology, biology and social sciences where researchers study causality and predict outcomes. Jamovi offers several types of regression analyses, including:

  1. Simple Linear Regression: This is simplest kind of regression where there is one dependent variable and one independent variable. It is used to examine the linear relationship that exists between two variables in question.

  2. Multiple Regression: This is where two or more independent variable are used to analyse a single dependent variable. It enables analysis to incorporate more than one factor as compared to the use of the single regression model.

  3. Logistic Regression: Used when the dependent variable is binary (e.g., yes/no, pass/fail), logistic regression helps in modelling the probability of a particular outcome.

  4. Polynomial Regression: This goes beyond the simple linear regression by taking the non-linear relationship between the independent and the dependent variable into consideration.

  5. Hierarchical Regression: This method allows for the stepwise inclusion of variables, helping to understand the incremental value of adding additional predictors.

In this guide, we will focus on performing a simple linear regression analysis using Jamovi, which is a foundational technique that students need to master before moving on to more advanced forms of regression.

Getting Started with Jamovi 

Jamovi is an opensource program that can be downloaded from the official website of the program; it supports major operating systems such as Windows, Mac OS X, and Linux. After installation of the software just open it and follow the below steps to conduct simple linear regression analysis. 

Step-by-Step Guide to Performing Simple Linear Regression in Jamovi 

In this illustration, we will use a dataset called "Exam Scores," which contains two variables: hours studied (independent variable) and exam scores (dependent variable). The hypothesis of the study is to find out if there exists a linear relationship between the number of hours spent studying and the scores that the students obtain in the exams.

Step 1: Importing Data into Jamovi 

  1. Open Jamovi: Launch the Jamovi application on your computer.

  2. Import Data: Click on the "Open" button in the top left corner of the screen, then select "Data Library" to browse through available datasets or "Computer" to upload your dataset from your device. For this tutorial, we'll assume you have your dataset saved as a CSV file named ExamScores.csv.

  3. Load the Dataset: After selecting the dataset, click "Open" to load it into Jamovi. You will see your data displayed in a spreadsheet-like format, similar to Excel.

Step 2: Setting Up the Regression Analysis

  1. Navigate to the Analyses Menu: On the top menu bar, click on the "Analyses" tab. A drop-down menu will appear with various analysis options.

  2. Select Regression: From the list of analysis options, select "Regression" and then choose "Linear Regression." This will open the linear regression setup panel on the right side of the screen.

  3. Specify Variables: In the linear regression setup panel, you will see two boxes labeled "Dependent Variable" and "Covariates."

       Drag the variable Exam Scores into the "Dependent Variable" box.

       Drag the variable Hours Studied into the "Covariates" box.

This tells Jamovi that we want to model the relationship between hours studied and exam scores.

Step 3: Running the Regression Analysis

  1. Configure Options: In the setup panel, you can configure additional options such as adding interaction terms, checking assumptions, and selecting robust standard errors. For this basic example, we will keep the default settings.

  2. Run the Analysis: Click the "OK" button at the bottom of the setup panel to run the regression analysis. Jamovi will automatically generate the output in the right panel, displaying the regression coefficients, model summary, and other relevant statistics.

Step 4: Interpreting the Results

Once the analysis is complete, Jamovi provides a detailed output that includes the following:

  1. Model Summary: This section provides an overview of the regression model, including the R-squared value, which indicates the proportion of variance in the dependent variable explained by the independent variable. In our example, if the R-squared value is 0.75, this means that 75% of the variation in exam scores can be explained by the number of hours studied.

  2. Coefficients Table: This table lists the regression coefficients for each predictor. The coefficient for Hours Studied tells us the expected change in Exam Scores for a one-unit increase in Hours Studied. For instance, if the coefficient is 5, this means that for each additional hour studied, the exam score is expected to increase by 5 points.

  3. Statistical Significance: The output also includes p-values, which indicate whether the relationships observed are statistically significant. A p-value less than 0.05 is typically considered significant, suggesting that the predictor variable (hours studied) has a meaningful impact on the dependent variable (exam scores).

Step 5: Visualizing the Regression Line

  1. Plotting the Regression Line: To visualize the relationship between the variables, you can create a scatter plot with a fitted regression line.

  2. Create Plot: In the analysis panel, select the "Plots" tab and check the box for "Fitted Line Plot." This will generate a scatter plot with the regression line overlaid, allowing you to visually assess the fit of the model.

Common Challenges in Jamovi Regression Analysis and How to Overcome Them

While Jamovi is designed to be user-friendly, students often face several challenges when performing regression analysis:

  1. Understanding Output: The output generated by Jamovi can be confusing for students. It is important to focus on key statistics such as coefficients, R-squared values, and p-values to interpret the results accurately.

  2. Choosing the Right Model: Selecting the right type of regression analysis is important. For instance, when one fits a model with the linear relationship, while actually the relationship exists non-linearly, then wrong conclusion is drawn.

  3. Data Preparation: It is always important to prepare and clean data before analysing it especially if you are dealing with large volumes of data. There are various issues such as missing values, outliers and incorrect data types can affect the regression analysis.

  4. Interpreting Multicollinearity: Multicollinearity must be checked while performing regression, where the independent variables are highly correlated. This can skew the results and makes it difficult to know the impact of each individual variable.

In order to address these challenges, the students can turn for Jamovi assignment help from our proficient writers. Professional services are helpful in data preparation, model selection, results interpretation and troubleshooting errors. Our services can help students do the right things which will lead to the production of good assignments and excellent grades.

Conclusion

In this tutorial we have walked you through how to do regression in Jamovi. We have covered the basics of regression, the different types of regression in Jamovi and a hands-on example using a popular dataset. Whether you are a beginner or looking to improve your skills this tutorial will help you navigate the regression features in Jamovi. Remember practice is key to mastering stats, so use the resources and seek Jamovi assignment help when needed. Contact us today.

Additional Resources for Jamovi Homework Assistance

  1. "Introduction to the New Statistics: Estimation, Open Science, and Beyond" by Geoff Cumming and Robert Calin-Jageman: This book provides a comprehensive introduction to statistical analysis using Jamovi, emphasizing estimation and open science practices.

  2. Jamovi User Guide: The official Jamovi documentation provides detailed instructions and examples for using the software's various features and performing different types of analyses. It is an invaluable resource for both beginners and advanced users. 

  3. Online Tutorials and Courses: Websites like Statisticshelpdesk offer assignment assistance and helpful material on statistics and data analysis using Jamovi, covering everything from basic concepts to advanced techniques.

Wednesday, 28 August 2024

Understanding Probability Distributions in Mathematical Statistics Assignments


Probability distributions are the fundamental base of mathematical statistics and are relevant to numerous analyses and research. Probability distribution refers to the manner in which values of a random variable are likely to be distributed. They give a mathematical relation of probabilities and the outcomes. This understanding enables statisticians to explain the outcomes of the random events such as rolling of a dice or measuring heights of people within a given population. The American Statistical Association has always prioritized the understanding of probability distributions for students in pursuing their course or careers in statistics and data science.

We will discuss probability distributions, the different types of probability distribution, and their application in statistics assignments. We will also include examples and references to support the concepts and we will suggest some useful resources and textbooks for better understanding. In the later part, we will explore how opting for mathematical statistics assignment help can make a difference in improving the grades and better comprehension. 

mathematical statistics assignment help with probability distributions


What Are Probability Distributions?

Probability distribution means a function that shows the probability of various outcomes occurring during an experiment. It displays a summary of probabilities concerning all the possible outcomes of a random variable. In other words, probability distribution show whether a certain event is likely to happen or not. Probability distributions can be classified into two broad categories: discrete probability distributions and continuous probability distributions. 

1. Discrete Probability Distributions: These distributions are applicable in cases where the random variable can have countable number (whole numbers) of possible values. Examples include the roll of a die, the number of heads in a series of coin tosses, or the number of cars arriving at a traffic light per hour. 

2. Continuous Probability Distributions: These distributions are used in cases when the random variable can assume an infinite number of values over an interval. Some of them are, the height of individuals in a given population group, the speed at which a computer can execute a job, or the amount of rain received in a given year. 

Understanding these two categories and the specific types of distributions within them is critical for any student of mathematical statistics.

Types of Discrete Probability Distributions

Let us explore into some common types of discrete probability distributions that are often covered in mathematical statistics courses. 

1. Binomial Distribution

The binomial distribution is one of the simplest and the most often utilized discrete distributions. Binomial distribution is used when you're counting how many times something happens (like winning a game or getting a heads) in a set number of tries, where each try is either a success or a failure. The probability remains constant with each trial being separate from one another.

Example: Consider a scenario where you flip a fair coin 10 times. The binomial distribution can help determine the probability of getting exactly 6 heads.

The formula for the binomial distribution is:


Where:

n = number of trials

k = number of successes

p = probability of success on each trial

C(n,k) = combination of n items taken k at a time 

2. Poisson Distribution

The Poisson distribution gives the number of times that an event happens in a given time or space. It is used when events happen independently, and the average rate of occurrence is known.

Example: If a customer support executive receives an average of 5 calls per hour, the Poisson distribution can be used to calculate the probability of receiving exactly 7 calls in a given hour.

The formula for the Poisson distribution is:


Where:

λ = average number of occurrences in the interval

k = number of occurrences 

3. Geometric Distribution

Geometric distribution describes the given number of trials that are needed for the first success in repeated, independent Bernoulli trials (trials with two possible outcomes: success or failure).

Example: If you are rolling a fair die, the geometric distribution can tell you the probability of getting your first six on the third roll.

The formula for the geometric distribution is:


Where:

p = probability of success on each trial

k = number of trials up to and including the first success

Types of Continuous Probability Distributions

Continuous probability distributions are equally important and are used in various scenarios in statistics. 

1. Normal Distribution

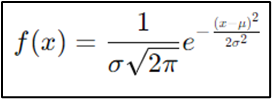
The normal distribution, also referred to as the Gaussian distribution, is one of the most widely used of all probability distributions. It explains the data concentrated around at the mean or average. Normal distribution is symmetric in characteristic and has most of the values congregated around the mean and has the characteristics of a bell-shaped curve.

Example: The distribution of heights in a population is often normally distributed, with most people having an average height and fewer people being significantly shorter or taller.

The formula for the normal distribution is:


Where:

μ = mean

σ = standard deviation 

2. Exponential Distribution

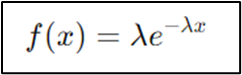
The exponential distribution is appropriate for modeling the time between independent events that occur at a constant average rate. This is mostly applied in reliability analysis and in queuing theory.

Example: The exponential distribution can model the time between arrivals of customers at a bank or the average age of a machine part.

The formula for the exponential distribution is:


Where:

λ = rate parameter (1/mean) 

3. Uniform Distribution

The uniform distribution is amongst the continuous distributions where all the outcomes have an equal probability. It is usually applied when there is no logic behind choosing one outcome over another within a specific range.

Example: If you randomly select a number between 1 and 10, the probability of each number being chosen is the same, illustrating a uniform distribution.

The formula for the uniform distribution is:


Where:

a = lower bound of the interval

b = upper bound of the interval

Applications in Mathematical Statistics Assignments

In many mathematical statistics assignments, these probability distributions are critical in solving problems related to data analysis, prediction, and inference. Here are a few applications: 

  • Hypothesis Testing: Probability distribution helps in identifying the likelihood of observing data under null hypotheses. For instance, the normal distribution is widely applied in z-tests and t-tests. 
  • Confidence Intervals: Confidence intervals use probability distributions to determine the range within which the given population parameter is likely to be found. 
  • Regression Analysis: Normal distributions are assumed for errors in regression analysis so as to draw inferences regarding the relationships between variables. 
  • Quality Control: Poisson distributions are commonly applied in quality control instances for purposes of estimating the number of defects in a batch of products.

What Challenges Do Students Face in Mathematical Statistics?

Mathematical Statistics assignment is often considered one of the most challenging subjects in master degree courses. Students often find themselves in a confusing state due to the difficulty involved. 

  • Probability Calculations: Problems that involves computing probabilities associated with binomial, normal, and Poisson distributions might be demanding in terms of precise calculations and a good grasp of underlying concepts. 
  • Hypothesis Testing: These problems include employing statistical tests such as t-tests, chi-square tests, and so on to see if there are sufficient evidence to reject the null hypothesis. Students must learn principles and the techniques of the tests and apply them correctly using data
  • Regression Analysis: Some assignments require students to develop regression models to make predictions on the basis of a given set of variables. This requires knowledge of linear and nonlinear regression, checking goodness-of-fit and testing on the relationships between variables. 
  • Statistical Inference: Questions may require making conclusions about a population based on sample data, involving concepts such as confidence intervals, p-values, and significance levels.

Mathematical Statistics Assignment Help: Your Pathway to Success

Our Mathematical Statistics Assignment Help service is designed to assist students with complex topics such as probability distributions, hypothesis testing, and regression models. We offer expert guidance and tailored solutions to help you understand challenging concepts and improve your academic performance.

How Our Service Helps Students Excel

Our assignment help service offers several unique benefits to students:  

  • Expert Guidance: Our team of seasoned statisticians and educators provide step-by-step explanations, ensuring students grasp the concepts behind each solution. 
  • Customized Solutions: Our help is personalized according to individual learning needs, from explaining fundamental concepts to solving computations. 
  • Practical Applications: We emphasize on realistic comprehension by establishing relationships between concepts and real problems, which is an essential component of mathematical statistics. 
  • Improved Grades: Our solutions guarantee better grades.

Conclusion

Probability distributions are crucial for analyzing data, predicting outcomes, and understanding randomness in mathematical statistics. By mastering these distributions and their applications, students can improve their ability to handle assignments and apply statistical concepts effectively. Our service offers expert support and personalized assistance to help you succeed in your coursework and exams. Avail our mathematical statistics assignment help today and experience the improvement in your course grades.


Helpful Resources and Textbooks

To deepen your understanding of probability distributions and their applications in mathematical statistics, here are some recommended resources: 

1. "Mathematical Statistics with Applications" by Wackerly, Mendenhall, and Scheaffer 

2. Introduction to Probability Models" by Sheldon Ross 

3. "Probability and Statistics for Engineers and Scientists" by Ronald E. Walpole, Raymond H. Myers, Sharon L. Myers, and Keying Ye