Wednesday 28 August 2024

Understanding Probability Distributions in Mathematical Statistics Assignments


Probability distributions are the fundamental base of mathematical statistics and are relevant to numerous analyses and research. Probability distribution refers to the manner in which values of a random variable are likely to be distributed. They give a mathematical relation of probabilities and the outcomes. This understanding enables statisticians to explain the outcomes of the random events such as rolling of a dice or measuring heights of people within a given population. The American Statistical Association has always prioritized the understanding of probability distributions for students in pursuing their course or careers in statistics and data science.

We will discuss probability distributions, the different types of probability distribution, and their application in statistics assignments. We will also include examples and references to support the concepts and we will suggest some useful resources and textbooks for better understanding. In the later part, we will explore how opting for mathematical statistics assignment help can make a difference in improving the grades and better comprehension. 

mathematical statistics assignment help with probability distributions


What Are Probability Distributions?

Probability distribution means a function that shows the probability of various outcomes occurring during an experiment. It displays a summary of probabilities concerning all the possible outcomes of a random variable. In other words, probability distribution show whether a certain event is likely to happen or not. Probability distributions can be classified into two broad categories: discrete probability distributions and continuous probability distributions. 

1. Discrete Probability Distributions: These distributions are applicable in cases where the random variable can have countable number (whole numbers) of possible values. Examples include the roll of a die, the number of heads in a series of coin tosses, or the number of cars arriving at a traffic light per hour. 

2. Continuous Probability Distributions: These distributions are used in cases when the random variable can assume an infinite number of values over an interval. Some of them are, the height of individuals in a given population group, the speed at which a computer can execute a job, or the amount of rain received in a given year. 

Understanding these two categories and the specific types of distributions within them is critical for any student of mathematical statistics.

Types of Discrete Probability Distributions

Let us explore into some common types of discrete probability distributions that are often covered in mathematical statistics courses. 

1. Binomial Distribution

The binomial distribution is one of the simplest and the most often utilized discrete distributions. Binomial distribution is used when you're counting how many times something happens (like winning a game or getting a heads) in a set number of tries, where each try is either a success or a failure. The probability remains constant with each trial being separate from one another.

Example: Consider a scenario where you flip a fair coin 10 times. The binomial distribution can help determine the probability of getting exactly 6 heads.

The formula for the binomial distribution is:


Where:

n = number of trials

k = number of successes

p = probability of success on each trial

C(n,k) = combination of n items taken k at a time 

2. Poisson Distribution

The Poisson distribution gives the number of times that an event happens in a given time or space. It is used when events happen independently, and the average rate of occurrence is known.

Example: If a customer support executive receives an average of 5 calls per hour, the Poisson distribution can be used to calculate the probability of receiving exactly 7 calls in a given hour.

The formula for the Poisson distribution is:


Where:

λ = average number of occurrences in the interval

k = number of occurrences 

3. Geometric Distribution

Geometric distribution describes the given number of trials that are needed for the first success in repeated, independent Bernoulli trials (trials with two possible outcomes: success or failure).

Example: If you are rolling a fair die, the geometric distribution can tell you the probability of getting your first six on the third roll.

The formula for the geometric distribution is:


Where:

p = probability of success on each trial

k = number of trials up to and including the first success

Types of Continuous Probability Distributions

Continuous probability distributions are equally important and are used in various scenarios in statistics. 

1. Normal Distribution

The normal distribution, also referred to as the Gaussian distribution, is one of the most widely used of all probability distributions. It explains the data concentrated around at the mean or average. Normal distribution is symmetric in characteristic and has most of the values congregated around the mean and has the characteristics of a bell-shaped curve.

Example: The distribution of heights in a population is often normally distributed, with most people having an average height and fewer people being significantly shorter or taller.

The formula for the normal distribution is:
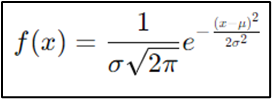


Where:

μ = mean

σ = standard deviation 

2. Exponential Distribution

The exponential distribution is appropriate for modeling the time between independent events that occur at a constant average rate. This is mostly applied in reliability analysis and in queuing theory.

Example: The exponential distribution can model the time between arrivals of customers at a bank or the average age of a machine part.

The formula for the exponential distribution is:
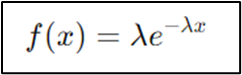


Where:

λ = rate parameter (1/mean) 

3. Uniform Distribution

The uniform distribution is amongst the continuous distributions where all the outcomes have an equal probability. It is usually applied when there is no logic behind choosing one outcome over another within a specific range.

Example: If you randomly select a number between 1 and 10, the probability of each number being chosen is the same, illustrating a uniform distribution.

The formula for the uniform distribution is:


Where:

a = lower bound of the interval

b = upper bound of the interval

Applications in Mathematical Statistics Assignments

In many mathematical statistics assignments, these probability distributions are critical in solving problems related to data analysis, prediction, and inference. Here are a few applications: 

  • Hypothesis Testing: Probability distribution helps in identifying the likelihood of observing data under null hypotheses. For instance, the normal distribution is widely applied in z-tests and t-tests. 
  • Confidence Intervals: Confidence intervals use probability distributions to determine the range within which the given population parameter is likely to be found. 
  • Regression Analysis: Normal distributions are assumed for errors in regression analysis so as to draw inferences regarding the relationships between variables. 
  • Quality Control: Poisson distributions are commonly applied in quality control instances for purposes of estimating the number of defects in a batch of products.

What Challenges Do Students Face in Mathematical Statistics?

Mathematical Statistics assignment is often considered one of the most challenging subjects in master degree courses. Students often find themselves in a confusing state due to the difficulty involved. 

  • Probability Calculations: Problems that involves computing probabilities associated with binomial, normal, and Poisson distributions might be demanding in terms of precise calculations and a good grasp of underlying concepts. 
  • Hypothesis Testing: These problems include employing statistical tests such as t-tests, chi-square tests, and so on to see if there are sufficient evidence to reject the null hypothesis. Students must learn principles and the techniques of the tests and apply them correctly using data
  • Regression Analysis: Some assignments require students to develop regression models to make predictions on the basis of a given set of variables. This requires knowledge of linear and nonlinear regression, checking goodness-of-fit and testing on the relationships between variables. 
  • Statistical Inference: Questions may require making conclusions about a population based on sample data, involving concepts such as confidence intervals, p-values, and significance levels.

Mathematical Statistics Assignment Help: Your Pathway to Success

Our Mathematical Statistics Assignment Help service is designed to assist students with complex topics such as probability distributions, hypothesis testing, and regression models. We offer expert guidance and tailored solutions to help you understand challenging concepts and improve your academic performance.

How Our Service Helps Students Excel

Our assignment help service offers several unique benefits to students:  

  • Expert Guidance: Our team of seasoned statisticians and educators provide step-by-step explanations, ensuring students grasp the concepts behind each solution. 
  • Customized Solutions: Our help is personalized according to individual learning needs, from explaining fundamental concepts to solving computations. 
  • Practical Applications: We emphasize on realistic comprehension by establishing relationships between concepts and real problems, which is an essential component of mathematical statistics. 
  • Improved Grades: Our solutions guarantee better grades.

Conclusion

Probability distributions are crucial for analyzing data, predicting outcomes, and understanding randomness in mathematical statistics. By mastering these distributions and their applications, students can improve their ability to handle assignments and apply statistical concepts effectively. Our service offers expert support and personalized assistance to help you succeed in your coursework and exams. Avail our mathematical statistics assignment help today and experience the improvement in your course grades.


Helpful Resources and Textbooks

To deepen your understanding of probability distributions and their applications in mathematical statistics, here are some recommended resources: 

1. "Mathematical Statistics with Applications" by Wackerly, Mendenhall, and Scheaffer 

2. Introduction to Probability Models" by Sheldon Ross 

3. "Probability and Statistics for Engineers and Scientists" by Ronald E. Walpole, Raymond H. Myers, Sharon L. Myers, and Keying Ye

Wednesday 21 August 2024

5 Simple Steps to Do Time Series Analysis in Python for Homework Help

 Python is considered to be the most widely-used programming language for data analysis because of its simplicity, versatility, and robust libraries. In the 2023 Stack Overflow Developer Survey, Python has occupied the third place with 43% of developers declaring its regular usage. Python’s popularity is not exclusive to developers only, but also students and academicians who find the language equipped with extensive libraries such as Pandas, NumPy and Matplotlib very useful for tasks such as data manipulation, analysis and visualization. Specifically in statistics, the robust capabilities of Python have revolutionized the way time series data (stock prices, weather trends or the spread of a disease) is analyzed to find startling insights. Time series analysis using python has benefit the students not only in upskilling their profile but also in grabbing lucrative jobs as a data analyst. Modern day data analytics courses have incorporated highly demanded python programming as a part of the curriculum. But it is often challenging for students to master python due to other academic pressures and commitment.  This is where Python homework help comes for rescue to extend a helping hand to complete assignments based on time series data.

time series python homework help


  Step 1: Understanding the Basics of Time Series Data 

Before diving into the technical aspects, it’s essential to understand what time series data is and why it’s different from other types of data.

Time series data is data which is collected or recorded at regular intervals of time. Such intervals may be in terms of seconds, minutes, hours, days, months or even years. One of the primary properties of time series data is the order of data points, which tells us how these datapoints are changing over a given period.

To illustrate this, let us take the daily closing prices of a stock as an example. Prices recorded at different instances represent its performance at different time points and studying this sequence is an effective way of identifying hidden performance patterns.

  Key Concepts in Time Series Analysis: 

 Trend: The long-term movement in the data.

 Seasonality: The repeating short-term cycle in the data.

 Noise: The random variation in the data.

 Stationarity: A time series whose statistical properties do not change over time.

  Step 2: Loading and Visualizing Time Series Data 

After getting acquainted with the fundamentals, the next logical step is to import your time series data into Python. Pandas’ library is one of the convenient options to load data.

Example: 

import pandas as pd 

import matplotlib.pyplot as plt 

# Load data 

data = pd.read_csv('your_time_series_data.csv', index_col='Date', parse_dates=True) 

# Visualize the data 

plt.figure(figsize=(10, 6)) 

plt.plot(data) 

plt.title('Time Series Data') 

plt.xlabel('Date') 

plt.ylabel('Values') 

plt.show() 

In this example, we load the time series data from a CSV file and set the date column as the index. The parse_dates=True argument ensures that the date column is interpreted as a date object. Visualizing the data is the first step to understanding its structure, identifying trends, and spotting any outliers.

  Step 3: Preprocessing the Data 

Data cleaning and preprocessing is one of the most important steps that must be done before any analysis is done on the data. When working with time series data, it is important to find and handle the cases of missing values, outliers, or irregular time intervals.

  Handling Missing Values:

# Fill missing values using forward fill 

data_filled = data.fillna(method='ffill') 

  Resampling the Data: 

In some cases, the data may not be in the frequency that is required for the analysis. For instance, you may have daily data but you wish to analyze it on a monthly basis.

# Resample data to monthly frequency 

data_monthly = data.resample('M').mean() 

Preprocessing is a critical step in ensuring that your analysis is accurate and reliable. Poorly preprocessed data can lead to wrong conclusions and inaccurate results.

  Step 4: Decomposing the Time Series 

Decomposing a time series involves breaking it down into its fundamental components: trend, seasonality, and residuals (noise). It is useful in understanding the underlying patterns in the data.

from statsmodels.tsa.seasonal import seasonal_decompose 

# Decompose the time series 

decomposition = seasonal_decompose(data_monthly, model='additive') 

decomposition.plot() 

plt.show() 

The seasonal_decompose function from the statsmodels library helps in visualizing the trend, seasonality, and residuals for a time series dataset. This decomposition can be used for subsequent patterns analysis or for application in different forecasting models.

Step 5: Building a Forecasting Model 

The last but the most important operation in time series analysis is the building of a model to forecast future values. Among all the available models the most widely used one for this purpose is the ARIMA (AutoRegressive Integrated Moving Average) model.

Example: 

from statsmodels.tsa.arima.model import ARIMA 

# Fit an ARIMA model 

model = ARIMA(data_monthly, order=(5, 1, 0)) 

model_fit = model.fit() 

# Make a forecast 

forecast = model_fit.forecast(steps=10) 

print(forecast) 

In this example, the ARIMA model is used to forecast the next 10 time periods. The order parameter specifies the lag, difference, and moving average terms for the model. Fine-tuning these parameters can improve the accuracy of your forecasts.

  Elevate Your Grades with Our Python Homework Help Services 

The Python Homework Help service is precisely tailored to meet your needs and ensure that not only the homework solutions are delivered on time, but also you gain the necessary understanding of the solution through post-delivery doubt clearing sessions. The Python assignment help is not only limited to answering the python problems, but also providing detailed step-by-step self-explanatory solutions, software steps and python codes that enhances your learning experience. Python codes along with comments explain each step of the coding process. Students can follow the software steps and run the python codes on their computer to generate the results.

  Comprehensive Support Across Multiple Software Platforms 

In addition to Python, our team of experts is proficient in a wide range of statistical and data analysis software, including:

     SPSS: Ideal for social sciences and market research.

     Excel: Widely used for data manipulation and visualization.

     SAS: Powerful for advanced analytics and predictive modeling.

     EViews: Perfect for time series econometrics.

     JMP: User-friendly for interactive data analysis.

     Stata: Great for statistical data analysis and visualization.

     Jamovi: An open-source alternative for easy statistical analysis.

     RStudio: The go-to for statistical computing and graphics.

     Minitab: Simplifies quality improvement and statistical analysis.

  Why Choose Our Services? 

     Expert Guidance: All our team members have years of experience in providing students custom assignment help using Python and other statistical software. 

     Tailored Solutions: Each work is individual, and our solutions are always aimed at addressing each assignment’s requirements.

     Learning-Oriented: We go beyond just solving problems by providing explanations that help you understand the "how" and "why" behind each solution.

     Timely Delivery: We understand how important deadlines are in the academic curriculum. Our services are fast and ensures that you never miss your deadline.

     Affordable Pricing: Our prices are affordable for every student without compromising on quality parameters.

  Conclusion: Mastering Python for Data Analysis 

Learning Python is advantageous for students for analyzing data and using it for data-driven decision-making, especially in time series analysis. However, the pressure to achieve good academic performance often creates an atmosphere of stress and anxiety amongst students. When you engage with our python homework help experts, you do not feel the burden of dealing with challenging python tasks involving advanced concepts and modeling. Besides better grade, you gain practical knowledge that boosts confidence in dealing with similar tasks in the future on your own. If you are having problems with Python or any other software, we stand ready to provide you with all round support. Do not let the academic pressure put you in a state of depression. Grab the benefits out of our services and achieve the best of results!

  Resources for Further Learning: 

     "Python for Data Analysis" by Wes McKinney: This book is a great resource for learning data manipulation with Pandas.

     "Time Series Analysis with Python" by Ben Auffarth: A comprehensive guide to mastering time series analysis using Python.

  FAQs 

  1. Why should I use Python for Time Series Analysis? 

Python is more suitable for time series analysis because of Pandas, NumPy, and Matplotlib libraries, which simplify the handling of data and visualization. Moreover, the Python programming language is also popular among the user community due to its flexibility and ability to be used by both novice and expert analysts for statistical computation.

  1. How can your Python Homework Help service assist me with my assignments? 

We offer help with your homework in Python, especially in conducting time series analysis through our python homework help service. We don’t just solve your assignments but also provide self-explanatory solutions so that the understanding of the concepts is easy.

  1. What other software support do you offer besides Python? 

Apart from Python, we provide support in statistical and data analysis software like SPSS, Excel, SAS, EViews, JMP, Stata, Jamovi, RStudio, and Minitab. Our tutors are well acquainted with these tools and would be pleased to assist you with any type of assignment, data analysis, or interpretations. 

  1. How do you ensure the quality and accuracy of the solutions provided? 

Our team of experienced professionals pays attention to every detail that goes into developing an assignment to ensure that when completed, it is accurate and relevant. We employ data analysis tools and techniques that aligns with the best practices in the field of data analysis and choose appropriate statistical methods for accurate results.

  1. Can I get help with urgent assignments or last-minute homework? 

Yes, we do provide solutions to assignments having tight deadlines. Our team ensures that the solution is prepared as per the instructions and rubric without any quality deficit. Our team is aware of the role of the due dates in academics and we believe in efficient working and timely completion.

  1. How do I get started with your homework help services? 

Getting started is easy! All you need to do is submit your assignment details on our website www.statisticshelpdesk.com, and our experts will give an estimate of how much it would cost and how long it would take to complete. Once the price is finalized, we shall proceed to work on your assignment and prepare the solution in the time frame agreed.

  1. Are your services affordable for students? 

Absolutely! Students always have a tight budget, and that is why we set reasonable prices for our services while maintaining high quality. We always aim to offer easy to understand solutions and free post delivery support to clarify all the doubts.